Pull up Ringgold, Georgia on two different real estate sites this summer and you get two different towns. One says the median home just sold for $600,000, up more than 135 percent from a year ago. Another says the typical home is worth $248,269, up a much calmer 21.9 percent. Same zip code. Same season. Numbers that are not even close to describing the same market.
If you are comparing Ringgold to somewhere else in the Chattanooga corridor, this is the moment where most people either panic or shrug and pick a number that sounds right. Neither response gets you closer to the truth, because the disagreement itself is the useful information. It tells you something specific about how Ringgold's housing stock is built and how thin the sales data really is here. Once you understand the mechanism, you stop asking "what's the median price in Ringgold" and start asking a much better question.
A Median Needs Volume To Mean Anything
A median works by lining up every sale from low to high and picking the one in the middle. That math is stable when you have hundreds of transactions feeding it every month, because outliers get absorbed into the crowd. A market with hundreds of transactions in a typical month can absorb the effect of one $600,000 custom build.
Ringgold does not have that crowd. The city itself has an estimated population of around 3,412, and its monthly closing count is measured in dozens, not hundreds. When a portal reports "the median sale price last month," it is really reporting whichever handful of homes happened to close in that specific window. Swap two or three transactions and the median can jump by six figures without the underlying market moving at all.
That is exactly what appears to be happening with the $600,000 figure. It is not a false number. It is a real median of a real, small batch of closings. It just is not describing the same thing that a typical-value index like Zillow's, which smooths for outliers and tracks the middle price tier over time, is trying to describe. One is a snapshot of whoever happened to sell. The other is closer to a trend line. Both are technically accurate, and both are separately useless if you do not know which one you are looking at.
Two Ringgold Examples That Show The Problem
You do not need a statistics background to see this. You just need to look at the examples.
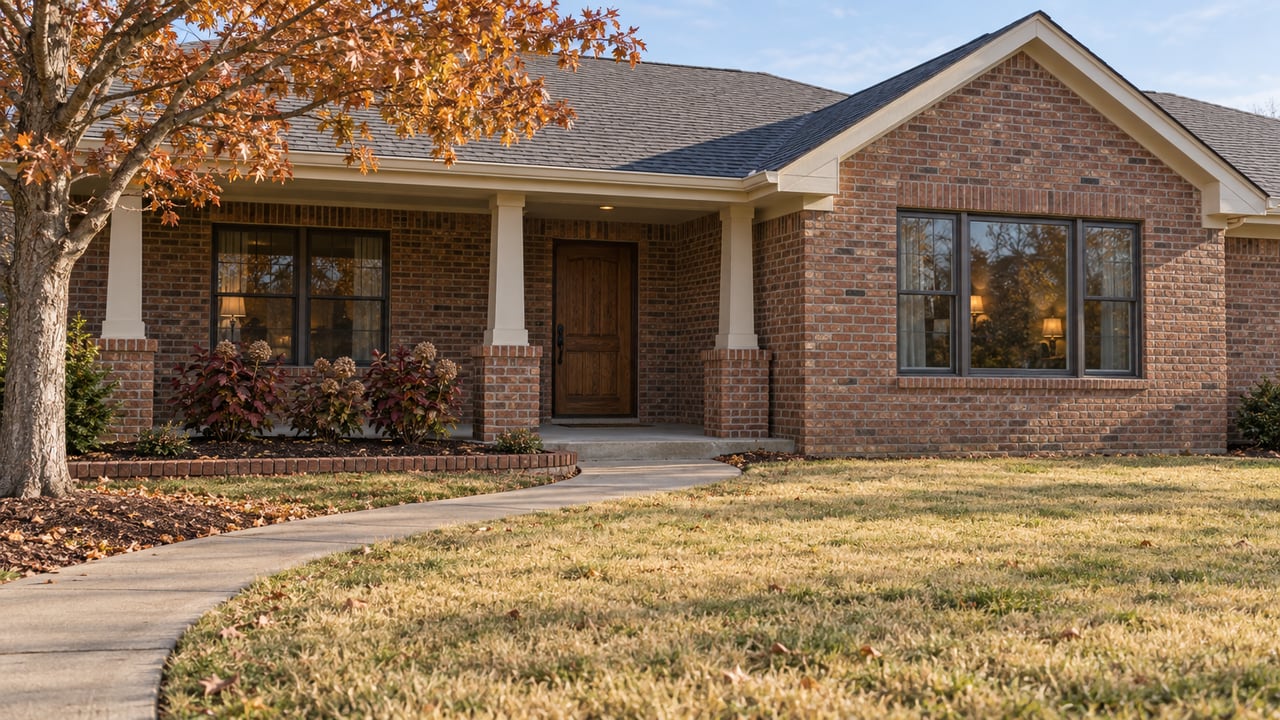
- 1208 Spring Meadows Drive, Ringgold sold on January 15, 2026, for $385,000. It has 3 bedrooms and 2 baths, spans 1,759 square feet, and took 49 days to find a buyer.
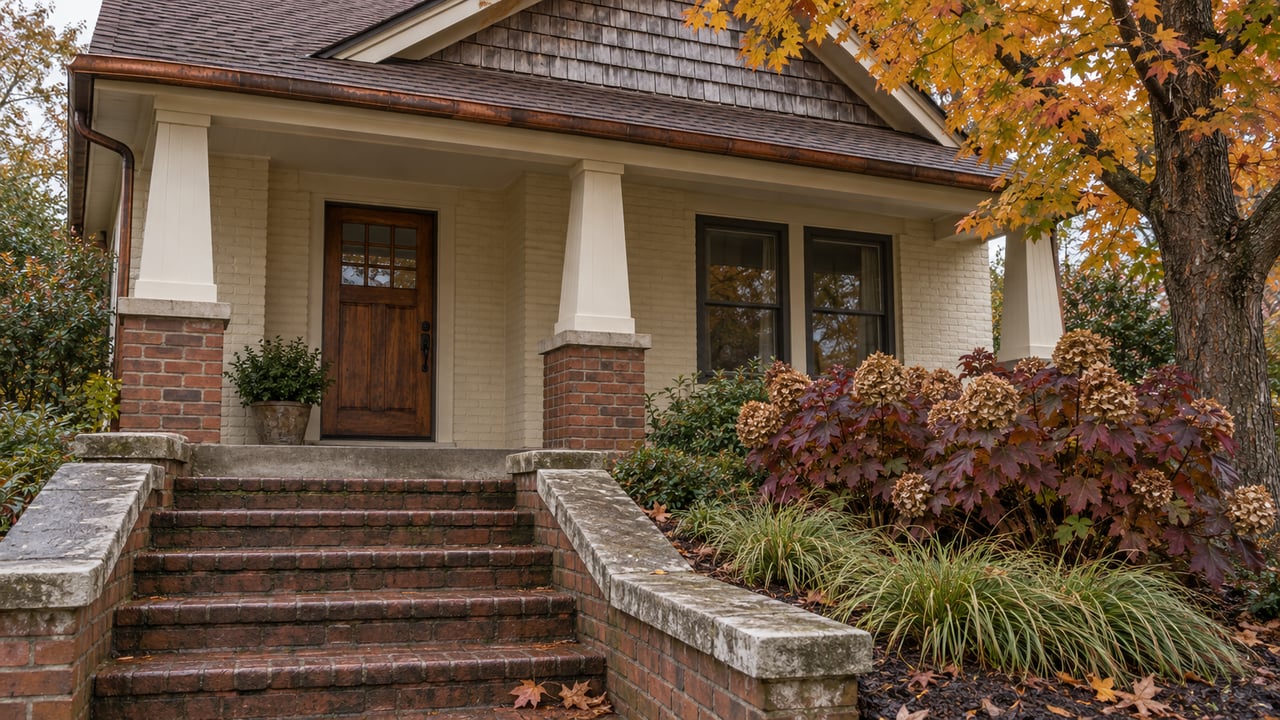
- A custom-built home in Heritage Estates, an established acreage neighborhood on Heritage Drive, was listed this year at $589,000. It sits on 2.17 private acres, runs 2,612 square feet, and was built in 1991. Homes in Heritage Estates rarely come up for sale at all.
The Spring Meadows Drive sale and the Heritage Estates listing show different kinds of Ringgold homes, but they are not like-for-like comps: one is a closed sale and the other is a listing. A citywide median for a month reflects the homes that actually closed in that window; it cannot by itself tell you what a typical Ringgold buyer will pay.
A Housing Stock Built In Two Very Different Eras
Part of why Ringgold's sales mix swings so hard is that the housing stock itself is unusually split. According to NeighborhoodScout's analysis of Census and resale data, just over half of Ringgold's homes, 52.37 percent, were built since 2000. That is a genuinely new housing stock by national standards. But the other half includes older in-town homes, 1990s acreage properties like the Heritage Estates listing above, and everything in between.
Layer onto that the fact that Ringgold sits at the edge of gated, golf-course communities like Windstone Golf Club, a guard-gated development straddling the Georgia-Tennessee line near Ringgold and Ooltewah, and you have a market where "a Ringgold home" could mean a starter house in a 2005 subdivision, a three-acre 1990s homestead, or a six-bedroom golf-course estate. A single median tries to represent all three with one number.
When just over half your housing stock was built since 2000 and the other half includes older in-town homes, 1990s acreage properties, and everything in between, the citywide median isn't measuring one market. It's summarizing several.
This is also why NeighborhoodScout's own appreciation data comes with a caveat worth repeating: cumulative appreciation in Ringgold over the past decade ranks in the top 40 percent nationally, but that number is a citywide average. Individual neighborhoods and subdivisions inside Ringgold can differ from that average by a wide margin, which is the same problem showing up again from a different angle.
What To Ask Instead Of The Median
If you are researching Ringgold from outside the market, here is what actually tells you something:
- Ask for closed sales in the specific subdivision you're considering over the trailing 90 days, not the citywide figure. A subdivision like the Meadows or an established neighborhood like Southern Heights will have its own price pattern that a countywide median erases.
- Ask whether the comps you're being shown are subdivision resales, new construction, or acreage properties. Mixing those three into one comparison is the exact mistake that makes headline medians misleading.
- Ask about price per square foot for homes of a similar build era, since a 2020s subdivision home and a 1990s acreage home on the same street can carry very different per-square-foot economics even at similar total prices.
- If you're weighing Ringgold against a Tennessee suburb across the state line, ask your agent to pull the actual closed comps on both sides rather than comparing two portal medians that were never built to be compared against each other.
This is the part of the process where a local, boots-on-the-ground read matters more than any dashboard. A number on a screen cannot explain the differences between the Spring Meadows Drive sale and the Heritage Estates listing; someone who has walked both neighborhoods can.
A Couple Of Straight Answers
So which number should I actually trust? None of them alone. Treat a single-month median as a snapshot of whoever happened to close, and treat a typical-value index as a smoothed trend line. Neither replaces looking at actual closed comps in the specific subdivision or neighborhood you're considering.
Does this only happen in Ringgold? It happens in any small market where the mix of housing types is wide and the monthly sales count is low. Ringgold is a clear example because its stock spans new subdivisions, older acreage homes, and gated estates all at once, but the same math applies to other small towns along the Georgia-Tennessee line.
Numbers from a portal can start a conversation, but they cannot finish one. If you are trying to figure out what a specific Ringgold neighborhood or subdivision actually costs right now, Wes Talley can walk you through the real comps, not just the headline. Let's Connect.